“Reduced Inequalities” in North America
 Adam MacRae
  December 2, 2022
Adam MacRae
December 2, 2022
December 2, 2022
Adam MacRae
December 2, 2022 On September 17th 2011, a group of protestors marched to Zuccotti Park in Wall Street denouncing what they viewed as unsustainable levels of income inequality in the United States.
Their protests, later called ‘Occupy Wall Street’ set off endless copycat movements around the world. Overnight, terms such as ’One Percenters’, and ‘We Are The 99 Percent’ became a part of everyday language. Income inequality became the centre of focus for academics and policymakers alike. So strong was this fascination that it launched a little-known academic named Thomas Piketty into relative stardom following the publication of his best seller: Capital in the 21st Century.
For this month’s edition, we go to North America and cover the UN’s 10th Global Goal of ‘Reduced Inequalities’. This briefing will attempt to cover the concept of income inequality, a notoriously complex subject combining a wide range of factors: inequalities within countries, between countries, inequalities of opportunity as well as that of outcome.
Specifically, we are focusing on reducing inequalities in regards to growth rates of household income per capita among the bottom 40% of the population.
On the surface, it is not difficult to see why income inequality strikes such a chord and inspires such fierce emotions. Below are a series of headline numbers that stand out.
Global wealth levels
Globally, the richest 1% of the population own 40% of the world’s total wealth, while the poorest 50% own 1%.
Generational divides
In terms of how many generations it would take for those born in the lowest-income families to approach the mean income in their home country, the OECD average is 4.5 generations.
Lifetime chances
Another way to think of the generational divide is the odds of those born into the bottom 25% of income brackets ending up in the top 25% earning brackets.
International inequality rankings
Significance
As striking as these are, the real significance is the potential impacts these inequalities have on society at large. Higher rates of income inequality are known to lead to political instability, economic stagnation, and social and physical consequences. Lowering these rates help reduce these associated risks across society.
The history of income inequality depends on the context. Even when examining the past 100 years of income inequality across the globe, a major distinction is whether you are looking at income inequality between countries or within countries. As this briefing is focused on household income per capita among the bottom 40% of the population, we will focus on inequalities within countries.
Despite significant progress made between countries for the last 40 years, this was not the case within countries. In fact, within countries, income inequality grew from 1990-2016 and accounted for nearly 70% of the global population. During this time, while the top 10% saw their incomes continue to rise, the bottom 50% saw their incomes fall.
In North America, this growth of inequality was particularly noticeable; the top 10%’s fortunes increased dramatically, while those in the bottom rings of the income ladder fell further and further behind.
When looking at the US specifically, the middle class has been declining for decades. In the 1970s, 61% of the population was considered middle class versus 51% in 2019; similar trends were experienced in Canada as well.
Ironically, it was also globalisation that led to increased income inequalities both in rich and poor countries alike. In wealthier countries, the gains were concentrated in the wealthiest of families that were able to capitalise on the new information-based economy. In poorer countries, the new jobs and opportunities shifting from the wealthier world were not evenly spread creating new income inequalities.
Within countries, being on the lower rings of the economic ladder was not an ideal place to be. If you were lucky enough to keep your job, odds were you were a frontline worker exposing yourself to a new and deadly virus putting your life at risk on a daily basis for what was often minimum wage. For those that were not so lucky to maintain their jobs or unable to work remotely, they found their economic fortunes evaporate overnight.
In the end, the legacy of the pandemic was that it severely disrupted progress made both within and between countries. Within countries, an estimated 70 million people were pushed back into poverty because of the pandemic. Between countries, for the first time in a generation, income inequality between countries rose by 1.2%.
Further, the return to a high-inflationary market across the globe, while painful for everyone, hurts the poorest the most.
Income inequality is one of trickier concepts to unpack with many factors and distinctions. Below in Table 1, we attempt to break it down into 2 simple categories.
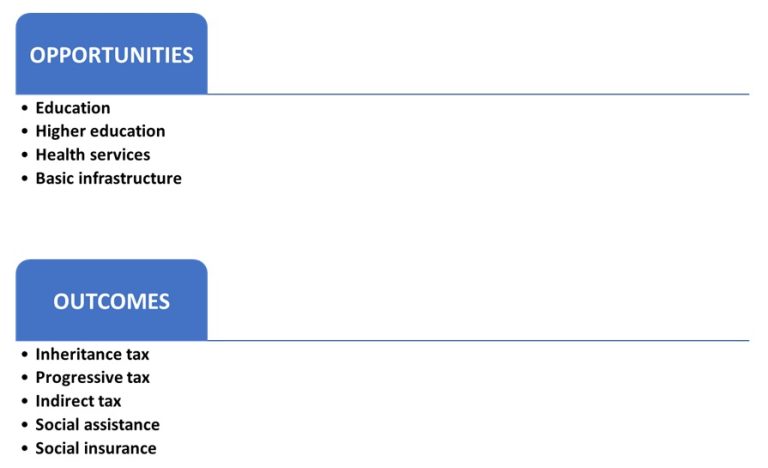
These 2 types are further broken down into opportunities versus outcomes:
Addressing the root cause of inequality within a specific country requires a deep appreciation and understanding of the local context. The same solution to address income inequality within the US with a focus on outcomes would not be fit to address income inequality rooted in opportunities more relevant in the Caribbean.
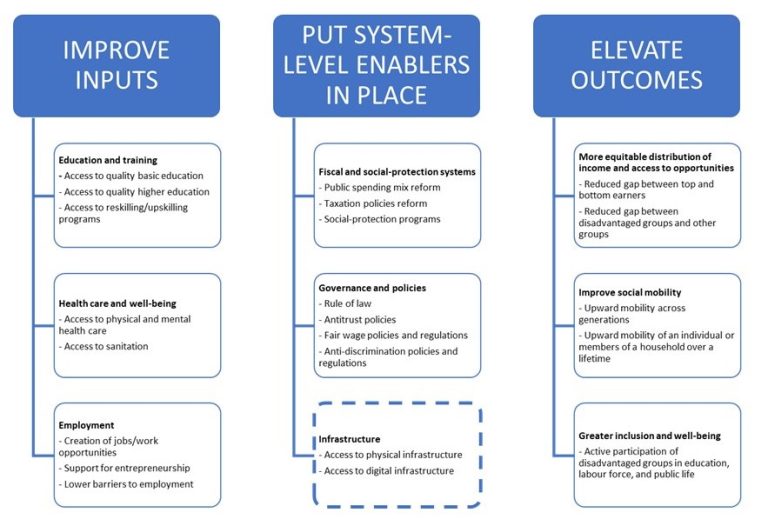
Given the complexities of income inequality, any solutions addressing it will need to have both opportunities and outcomes in mind. BCG, a consultancy, developed a framework on how to address income inequality. Highlighted in Table 2, the framework of solutions includes 3 core verticals: inputs, enablers, and outcomes. Within each vertical across the value chain are a subset of targets such as education within Inputs, rule of law within Enablers, and distribution of income under Outcomes. The benefit of the framework is that it allows for policymakers and decision makers to tailor efforts to reflect local needs.
Going forward, it will require a series of trials and errors over many years to make any significant progress to address income inequality. At Holocene, while we are not directly set up to address income inequality, our work potentially addresses and supports the efforts. We specialise in providing capital solutions for both infrastructure and clean energy projects. As mentioned in the BCG framework above, infrastructure, when done properly, can serve as a system-level enabler for progress. Green energy on the other hand has many potential co-benefits including the reduction of local emissions which lead to better health and well-being; a critical input.
If you would like to learn more about the work we do at HIC or how we can help your sustainable project get off the ground, get in touch by emailing info@holoceneic.com.